PGBADGER is an awesome tool: A fast, PostgreSQL log analysis report.
It works by analyzing PostgreSQL logs, and generating HTML reports that will give you a lot of information on query performance, locking queries, errors, connections, vacuums and pretty much everything you need to analyze a PostgreSQL server.
A (very) simplified PGBADGER installation goes something like this:
I've seen PGBADGER installations update log analysis daily, hourly, every ten minutes, etc. I usually like to keep my log analyzer as updated as possible.
On small PostgreSQL installations, PGBADGER usually runs on the very same server the PostgreSQL is installed on. This is fine for most use cases.
However, if the PostgreSQL is a busy server (high load) this is not recommended. PGBADGER script, when dealing with huge log files, can be very demanding as expected. So, what I like in those cases is either:
a) Run just once a day, at times when the server is mostly idle (after midnight). This is not always possible, specially if PostgreSQL is serving an application that is run in different timezones.
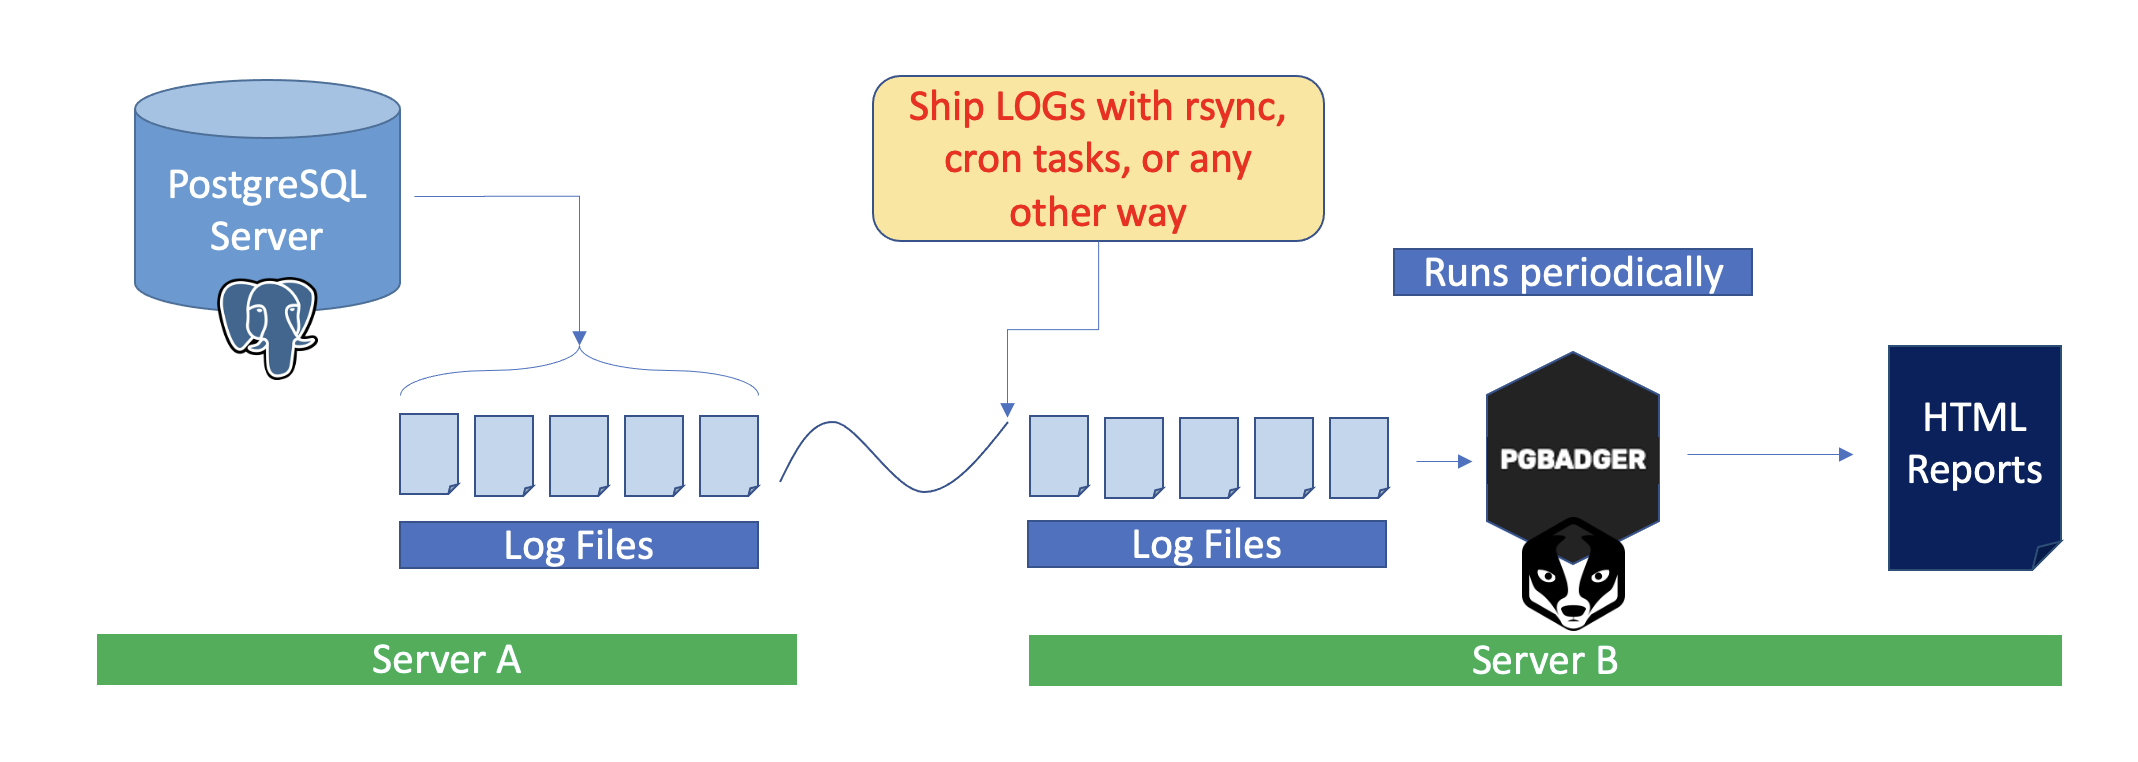
b) Or, just send the logs periodically to a different server and do the log analysis there (my preferred way).
The installation will be something like this:
So, here is what I usually do (YMMV):
1. Configure PostgreSQL in SERVER A so it will write LOGs that PGBADGER will be able to process. In this example, I am going to rotate and ship PostgreSQL every ten minutes.
2. Install PGBADGER in SERVER B
Make sure there is enough storage to hold PostgreSQL history for at least 36 months. It is usually a good idea to keep history to reflect some possible software or application load changes over time. It saved the day for me more than you would think.
In my case (a mostly DEBIAN/APT based distribution guy) it is just:
These are the parameters I change in postgresql.conf file:
logging_collector = on
log_directory = '/var/log/postgresql'log_filename = 'postgresql-%Y-%m-%d_%H%M%S.log'log_rotation_age = 10minlog_min_duration_statement = 0log_checkpoints = onlog_connections = onlog_disconnections = onlog_duration = on
log_line_prefix = '%t [%p]: user=%u,db=%d,app=%a,client=%h '
log_lock_waits = on
log_autovacuum_min_duration = 0
3. Configure ssh-key based authentication for ssh access from SERVER A to SERVER B
This is important: you don't have to, but it will make it easier for you if you use postgres user in SERVER A to do this because it already have access to the log files.
These are the steps you need:
3.1 SERVER A - Create a ssh-key for the postgres user.
This will create two files. If you use the default values on a debian based system, the will be:
/var/lib/postgresql/.ssh/id_rsa
/var/lib/postgresql/.ssh/id_rsa.pub
3.2 SERVER B - Create the user that will own the log files and run the PGBADGER commands
Since the analyzed files reports will be HTML files, it will become very handy if this user has access to a directory that can be exposed through a WebServer (Apache, NGINX, IIS, or any other you use).
In this user's home, if it does not already exist, create this file:
/home/username/.ssh/authorized_keys
Two important things here:
a) /home/username is just an example here. Make sure you use the home directory for the created user.
b) this file, and the directory containing it MUST REVOKE ANY TYPE OF ACCESS to GROUP and OTHERs so make sure permissions are correct for it.
If you need to, change file permissions like this:
chmod 600 ~/.ssh/authorized_keys
In this created or existing file, append the contents of file
id_rsa.pub that was created in step 3.1.
3.3 SERVER A - Check that you can login on SERVER B without using password.
This is easy. Logged in as the postgres user make sure you can ssh access ERVER B without typing a password.
SERVER A> $ ssh username@SERVERB
SERVER B> $ echo I am in in SERVER B and I did not type a password to login
4. SERVER B - Create a script to run PGBADGER remotely
File name should be: /home/username/bin/run-pgbadger.sh
#!/bin/bash
LOGS_DIR=/home/username/pgbadger/tmp_files
PGBADGER_HTML_DIR=/var/www/html/pgbadger/
NJOBS=10
echo "Unzipping log files"
gunzip -v $LOGS_DIR/*.log.gz
echo "Processing pgbadger with $NJOBS jobs"
pgbadger -j $NJOBS -I --outdir $PGBADGER_HTML_DIR $LOGS_DIR/*.log
echo "Removing log files"
rm -v $LOGS_DIR/*.log
echo "DONE"
And make sure it has EXECUTION permissions.
$ chmod 750 /home/user/bin/run-pgbadger.sh
Important script variables:
a) LOGS_DIR: where log files are going to be temporarily stored when shipped from SERVER A
b) PGBADGER_HTML: where analysis result with be incrementally calculated and stored. It will be useful if this directory is accesible through a WEB SERVER. Example: http://server-b/pgbadger
c) NJOBS: how many jobs will process the analyzed files in parallel.
5. SERVER A - Create a log shipping script to run on SERVER A every 10 minutes
File name should be: /var/lib/postgresql/bin/ship-logs-to-pgbadger.sh
#!/bin/bash
LOGS_DIR=/var/log/postgresql
REMOTE_DIR=/home/username/pgbadger/tmp_files
REMOTE_PROCESS=/home/username/bin/run-pgbadger.sh
SERVER_B=username@SERVERB
echo "Compressing files"
find $LOGS_DIR -cmin +1 -exec gzip -v {} \;
echo "Sending files and removing them afterwards"
rsync --remove-source-files -av $LOGS_DIR/*.log.gz $SERVER_B:$REMOTE_DIR
echo "Executing remotely PGBADGER"
ssh $SERVER_B "$REMOTE_PROCESS"
echo "Done"
Important script variables:
a) LOGS_DIR: where PostgreSQL's log files are stored
b) REMOTE_DIR: this is SERVER B's directory that will have the log files temporarily (MUST match what you've configured in step 4).
c) REMOTE_PROCESS: this is SERVER B's script that will be executed after log files ship (MUST match what you've configured in step 4).
d) SERVER_B: username and server address to access remotely (MUST match what you've configured in step 3).
6. SERVER A - Manually run script from step 5 to see if everything is working
/var/lib/postgresql/bin/ship-logs-to-pgbadger.sh
After running, if everything is OK (it might take a while the first time) you can point your browser to:
http://server-b/pgbadger
And PGBADGER reports should be good to go.
7. SERVER A - Configure a cron task to execute the script every 10 minutes and run PGBADGER analysis tool
*/10 * * * * /var/lib/postgresql/bin/ship-logs-to-pgbadger.sh
That is all. Enjoy!